With sport all over the world undergoing major disruption, increased attention has been placed on the difference in structure, governance, and financials of different league models.
In particular, there is growing interest in the traditional sports leagues “across the pond” in the USA (and Canada) and how they differ from Europe’s football “Big 5”. A lot of focus is placed on the North Americans’ aversion to the concept of promotion and relegation, perhaps the biggest driver of excitement and fan engagement in European football (and probably the most fiercely opposed concept to have been considered over here in the “old world”), but that is a meaty subject worthy of its own post. In this piece, we will look at the basics: how are the leagues structured, how do the key revenue steams compare (in size and distribution) and how do the two continents stack up in terms of attendances and broadcasting revenues.
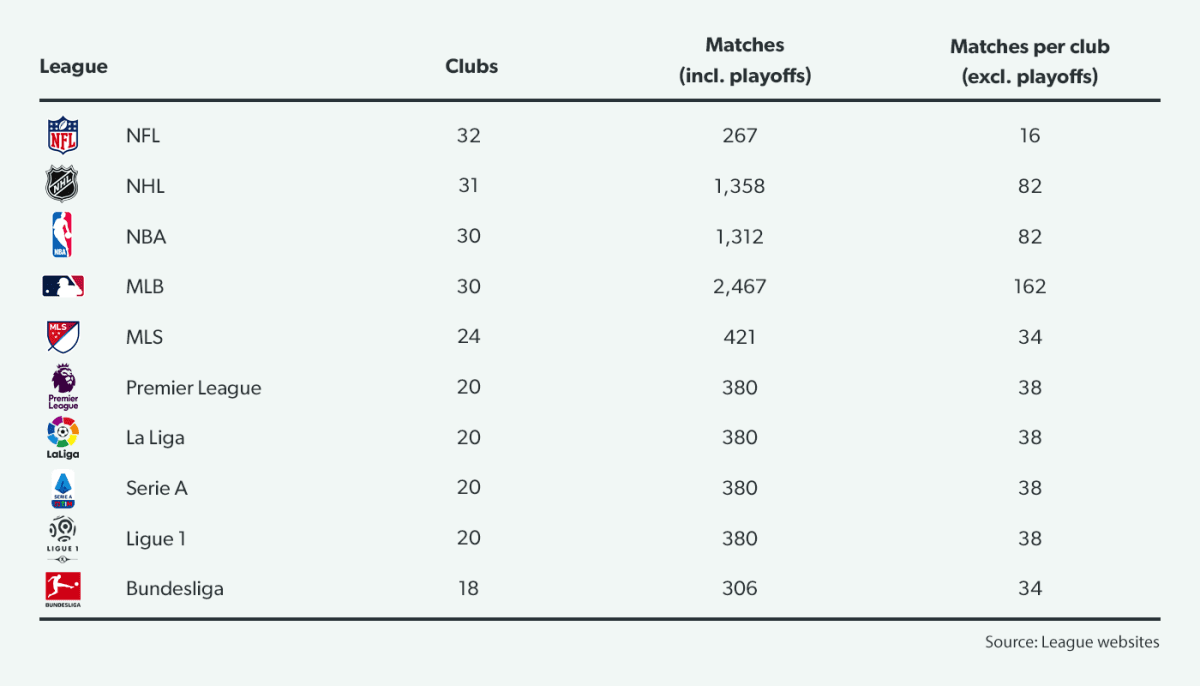
More clubs and many more matches
The five US leagues (four of which are also played in Canada) have an average of ten more clubs (29.4) than those
in Europe (19.6). While European football generally has 380 games per season (306 in the Bundesliga) and does not have a playoff structure, more matches are played in the MLS (421), NBA (1,312), and NHL (1,358), while Major League Baseball plays an astonishing 2,467 games per season (all numbers include playoffs). Excluding playoffs clubs in the NHL and NBA play 82 games each, MLB clubs 162. The NFL is the outlier at 16 games per club in the regular season.
 Source: Tifosy analysis
Larger revenues, more evenly distributed
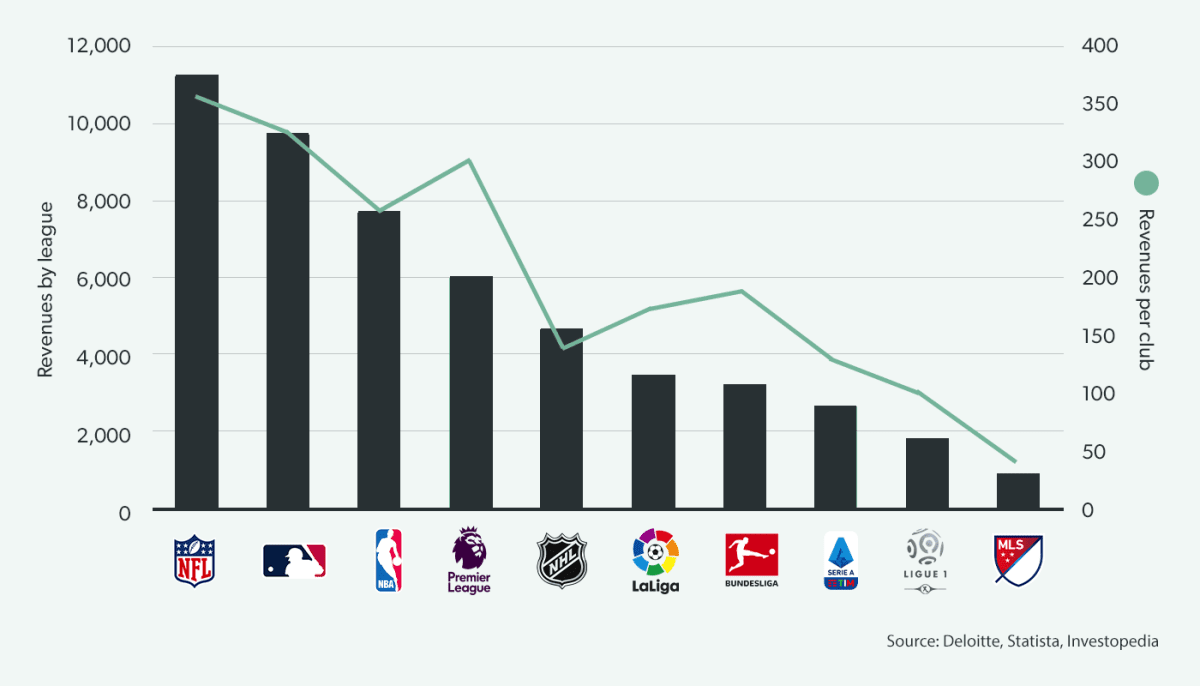
The five North American leagues generated revenues of €34bn in the season ending 2019, twice those of Europe’s Big 5 at €17bn. Four of the top five leagues by revenue are the traditional North American sports – NFL, MLB, NBA, and NHL. The Premier League is the only European competition to have broken into the global top five, while the sum of revenues of the other European leagues amounts to less than those of the NFL on its own. The MLS, founded in 1996, has revenues of €860m, which are approaching half those of France’s Ligue 1. However, on a per club basis the picture is different: the top two remain the same with revenues per club of €356m (NFL) and €326m (MLB); the Premier League moves into third place above the NBA, and both the Bundesliga and La Liga climb above the NHL with revenues of €186m and €169m respectively. Italy’s Serie A, Ligue 1 and the MLS occupy the bottom three spots on both an absolute basis and per club.
North American sports leagues are structured differently to European football, with a greater degree of control from central bodies over revenue development, collective bargaining agreements and distribution to clubs. A key outcome of this greater control is a higher degree of equality between member clubs: in North America, the top half of the division controls 58% of revenues on average, compared with 78% in European football. The highest discrepancy exists in Spain’s La Liga, whose top ten clubs enjoy 83% of the league’s collective revenues, while the bottom ten are left with just 17%. The other three leagues on the European continent are not dissimilar.
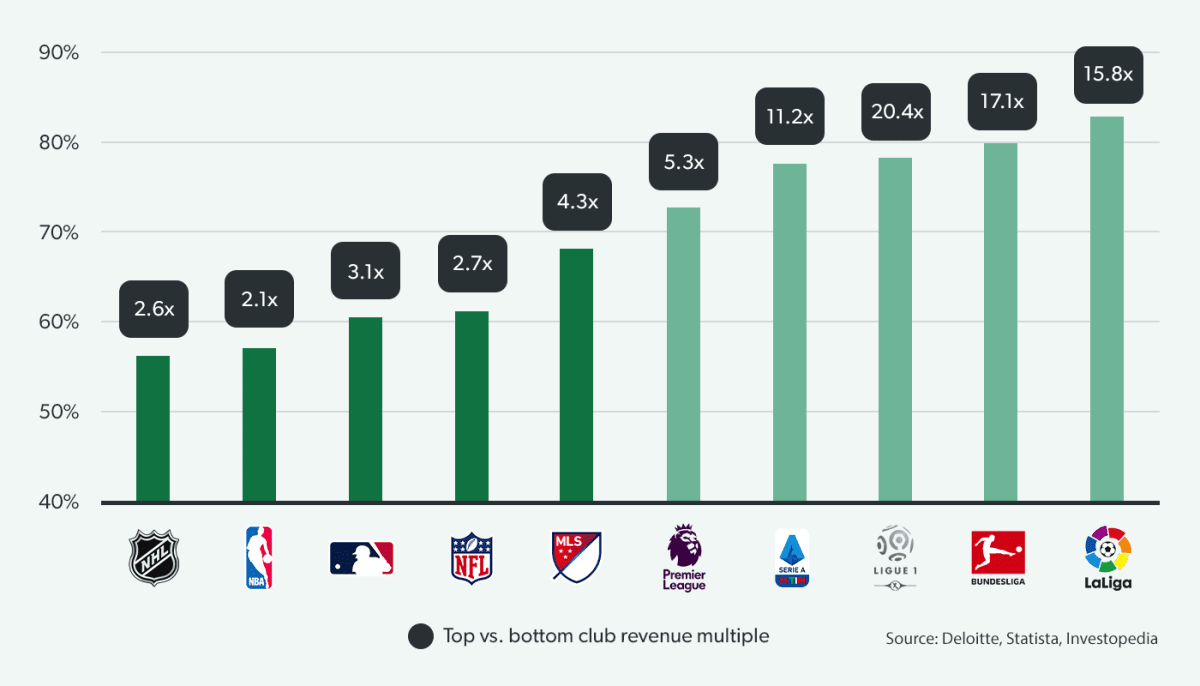
The top-to-bottom club revenue disparity is also dramatically different: the biggest North American clubs by revenue lead the smallest by a factor of 2.6x. The lowest multiple occurs in the NBA, where top club the New York Knicks generate revenues of $472m, around 2.1x the revenues of the bottom club the New Orleans Pelicans at $224m. In European football, the average factor is 11.6x, led by Ligue 1 where PSG has revenues of €659m, 20.4x those of Nîmes at €32m. Notably in the Premier League, often praised for its high level of competitiveness, top club’s Manchester United’s revenues were only 5.3x higher than those of the smallest club in the 2018/19 season, Huddersfield Town.
Europe leads attendance and broadcast revenue per match
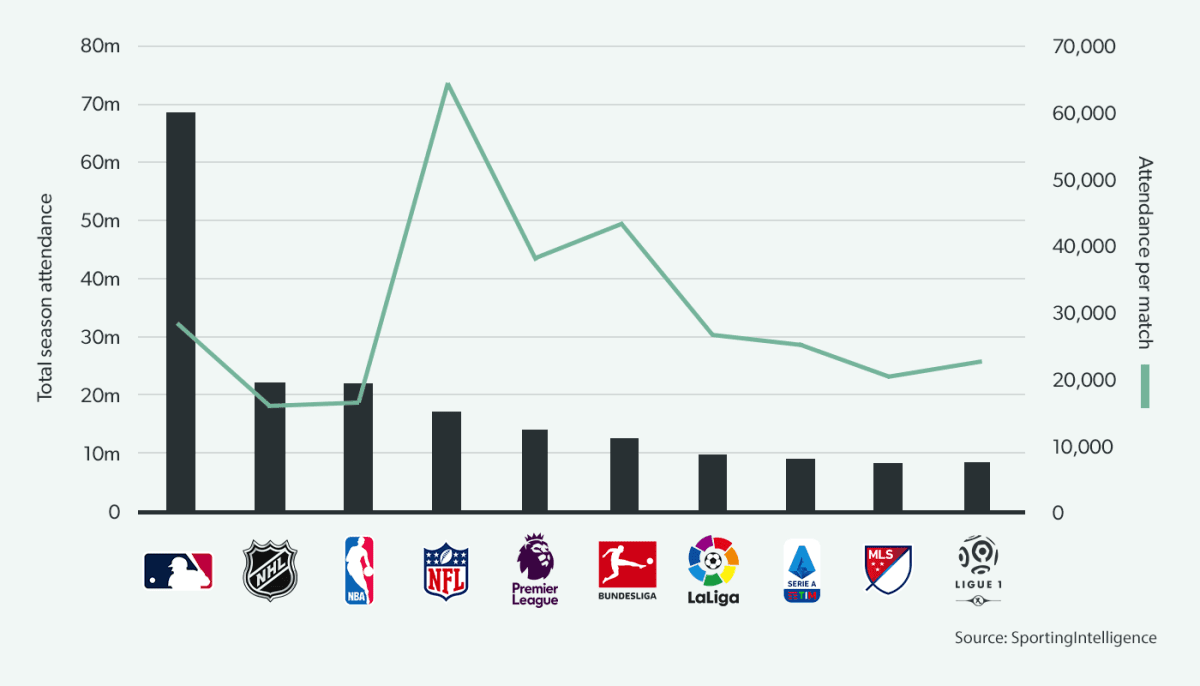
Overall attendances are higher in all of the North American sports except for the MLS, which makes sense given the significantly higher number of games played: the nearly-2,500 games of the 2019 Major League Baseball season attracted 68.5 million fans in total, more than three times any other league in across the two regions. On a per game basis, the picture changes significantly, with an average of 30.8k attending European football, 30% higher than the 23.7k average in North American sports. NFL fixtures retain the top spot for per-game attendance, with each fixture averaging 64.3k fans in the stadium.
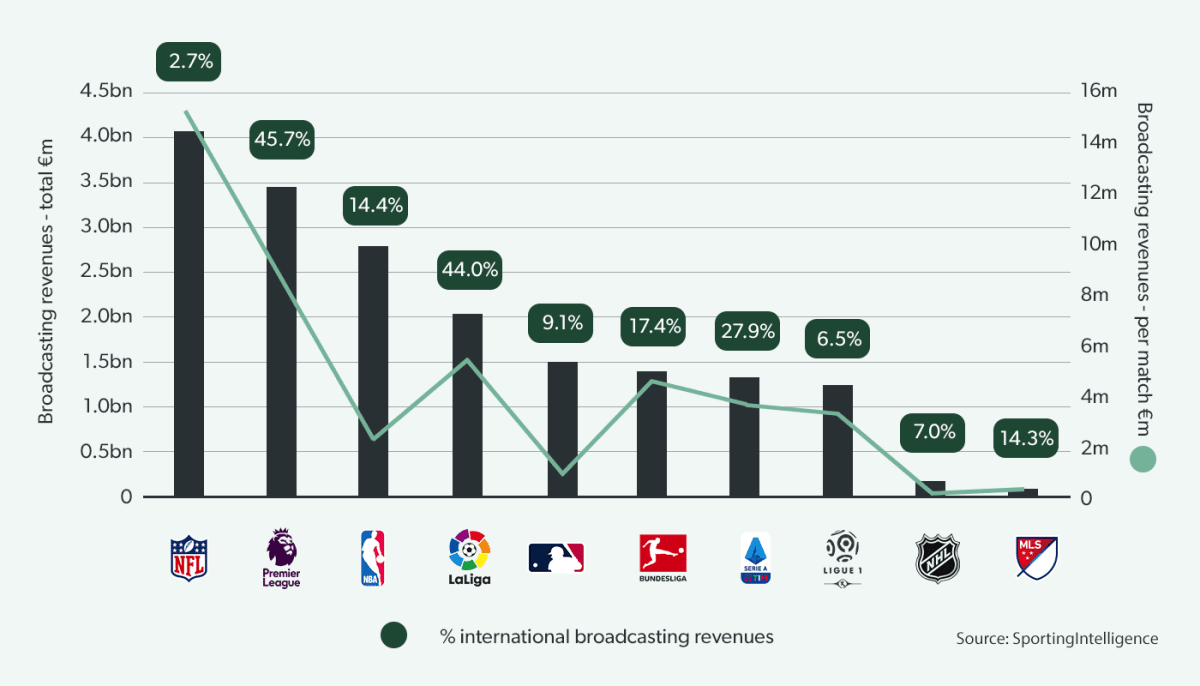
Turning to broadcast revenues, rights for Big 5 European football were sold for €9.5bn for the season ending 2019, 10% higher than the €8.6bn brought in by the Big 5 North American sports. On a per-match basis, the NFL is again the top-scorer at €15m per game, but all other American sports leagues fall significantly behind European football, which averages over €5m per match.
On a per game basis, the picture changes significantly, with an average of 30.8k attending European football, 30% higher than the 23.7k average in North American sports.
European football also attracts far higher revenues from selling rights to the international audience. Perhaps surprisingly given the growth in interest in America sport, only 8% of North American broadcasting revenues come from international contracts, which falls to less than 3% for the NFL. This in comparison to an international share of 33% of broadcast revenues for European football – with the Premier League (46%) and La Liga (44%) leading the pack.