Within days of the postponement of football competitions around the world in the early part of 2020, questions were being asked about the potential wider impacts of Covid-19 on the global game.
While some still held out hope that leagues could be resumed within a matter of weeks, others predicted deeper consequences, both on the ability of leagues to play out their remaining fixtures and on the wider business of football as part of the sports and entertainment industry.
Eventually, the majority of top-tier competitions got underway again, behind closed doors, and leagues were able to honor broadcasting contracts to ensure their most significant revenue streams were largely protected. But the costs of revenues that had been lost were already being counted, and predictions were being made for the quietest year in player transfers for a very long time.
Full data is now in. FIFA released its annual report on the global transfer market, and we have sifted through it to bring you the key highlights of international football transfers in 2020 and how the dynamic of the market and growth over the past few years have been impacted by the uncertainty in the sport.
2020 saw a sharper decrease in fees than the number of transfers
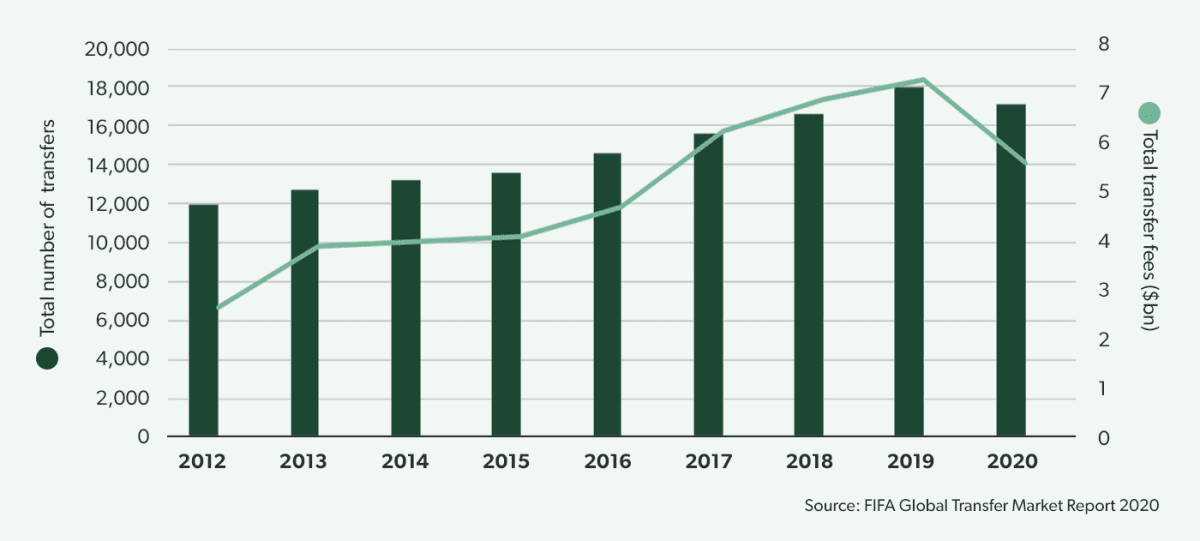
We start with the big picture. Overall, the number of international transfers completed in 2020 declined for the first time in 10 years. The number fell from 18,047 in 2019 to 17,077 in 2020, which was a relatively modest drop of 5.4% and not as significant a fall as some had predicted. Indeed, the number was still above the 2018 total of 16,547 transfers.
Fees paid for transfers were impacted far more significantly, however, as the average player cost came down. The total spending on players of all clubs combined fell from $7.3bn in 2019 to $5.6bn in 2020, a drop of $1.7bn (-23.4%). This put the market value to its lowest level since 2016 and reflected the pressure some clubs were under to sell players to help offset losses, even if it meant accepting lower fees.
Summer transfers become Autumn transfers
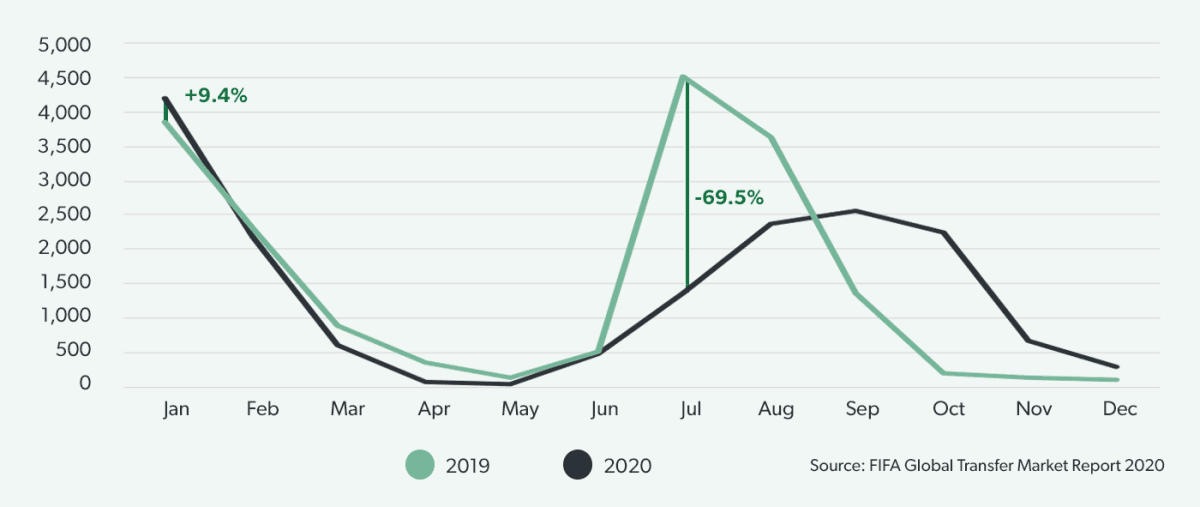
The number of transfers in January 2020 was up 9.2% on the previous year as the Winter window showed signs of the continued exuberance of the market. Without the disruption which followed soon afterward, 2020 may have been another year of new records being set.
As league seasons were pushed back into the Summer after the extended hiatus, so the peak of the transfer market was also shunted into the Autumn. Transfer windows were delayed and then extended, and the number of international transfers taking place in July was down 69.5% on the previous year. Summer transfers peaked in September (2,569 transfers) and were still going strong in October.
As league seasons were pushed back into the Summer, the peak of the transfer market was also shunted into the Autumn. Transfer windows were delayed and extended, and the number of international transfers taking place in July was down 70% on 2019.
Loans now account for a larger portion of transfers
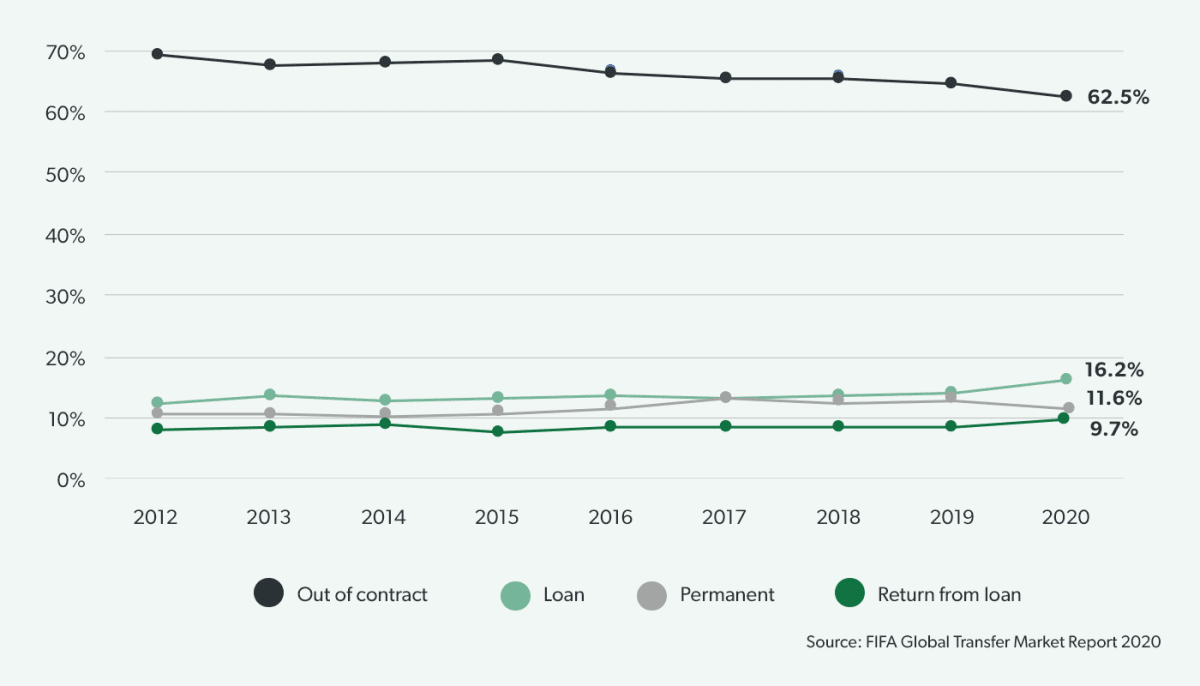
While most attention in Europe is on player moves focused on big money permanent moves, these actually represent a relatively small part of all international transfer activity across the world and fell to a new low of 11.6% of all transfers in 2020.
At a global level, the most common type of transfer is the signing of out-of-contract players. In 2020 these dropped to 62.5% of all transfers, continuing a downward trajectory which has been going since at least 2012. This may be partly as a result of clubs in general being unwilling to commit themselves to permanent deals: loans and returns from loans accounted for a higher percentage of moves than in 2019, at 16.2% (up from 14.2% in 2019) and 9.7% (up from 8.6% in 2019) respectively.
Sell-on fees are more common in younger players’ contracts
In the modern game, sell-on fees have become a very important source of income, in particular for smaller clubs. While they are rarely able to hold on to promising young players when scouted by larger or wealthier clubs and typically have to accept a relatively modest fee initially, they are often able to build a potentially higher payday into the future by inserting this kind of fee. 51.4% of all international transfers involving a fee in 2020 included a sell-on fee, up from 47.9% in 2019.
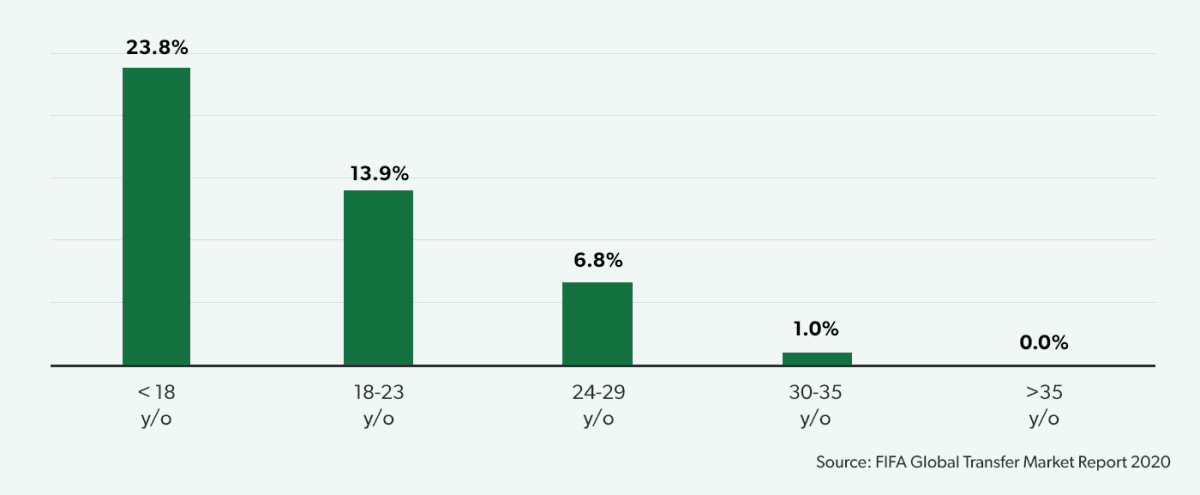
Of course, age is an important factor: the chances of a player moving on to an even bigger club are higher when he is continuing to develop his abilities, and the likelihood of a sell-on fee being included in a transfer contract is more than 3x greater for a player under the age of 18 than for a player aged between 24 and 29.
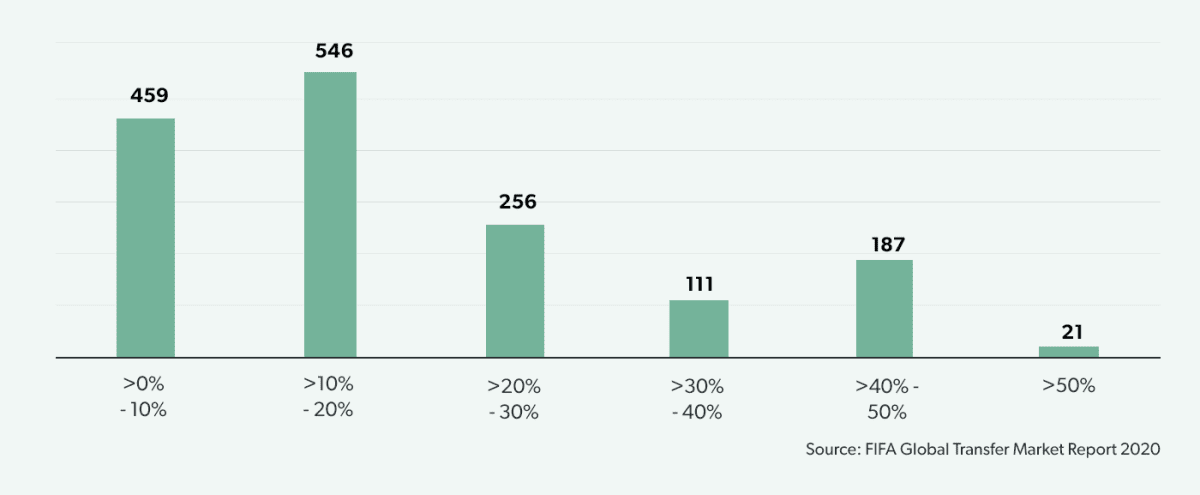
The most common range of sell-on fees is between 10% and 20%, followed by those under 10%. Indeed these two bands accounted for approximately two-thirds of sell-on fees in 2020, although there were also a significant number of transfers (575 of 1,580) in which the sell-on fee was over 20%. In 21 of these cases, the sell-on fee was over 50%.
Under 18 year olds also secure longer contracts than any other age group
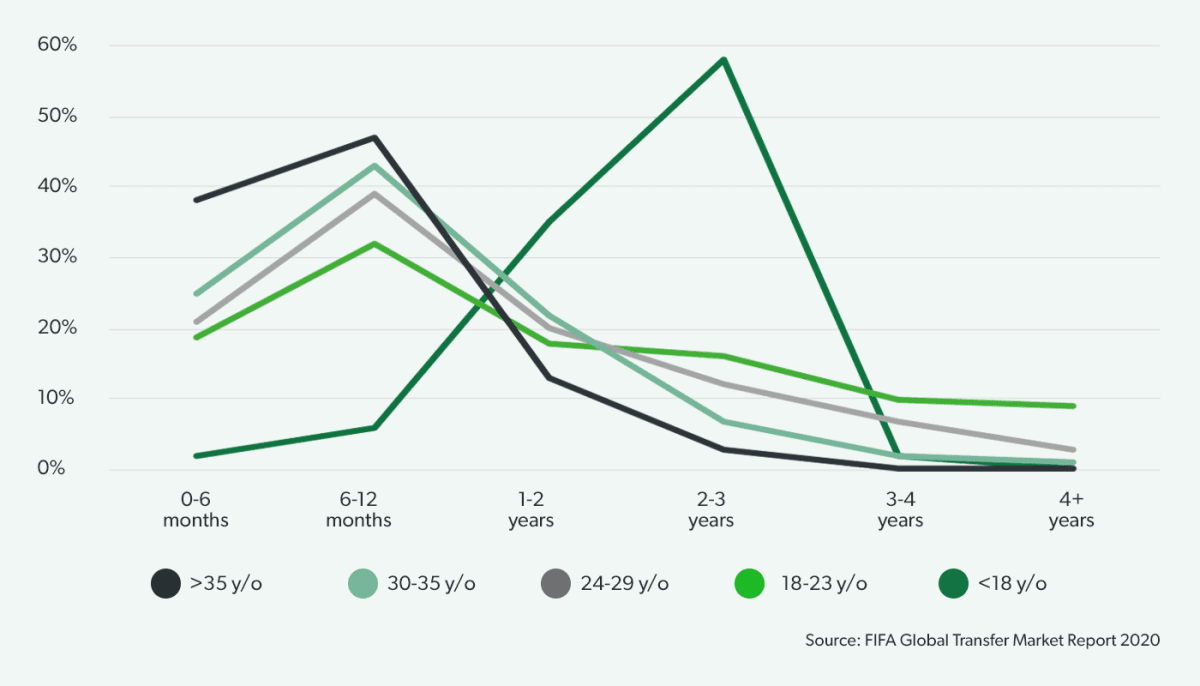
Contracts of 6-12 months in length were the most common for all age groups across global international transfers, except for in the under 18s category, where clubs were significantly more likely to sign contracts of 2-3 years. It is rare for a contract of over 4 years to be given to a player over the age of 30 and non-existent for those over 35 years old.
60% of transfers in which no fee is involved (86.7% of transfers) come with an employment contract of up to one year, with another 20% of these transfers signing a contract of up to two years.
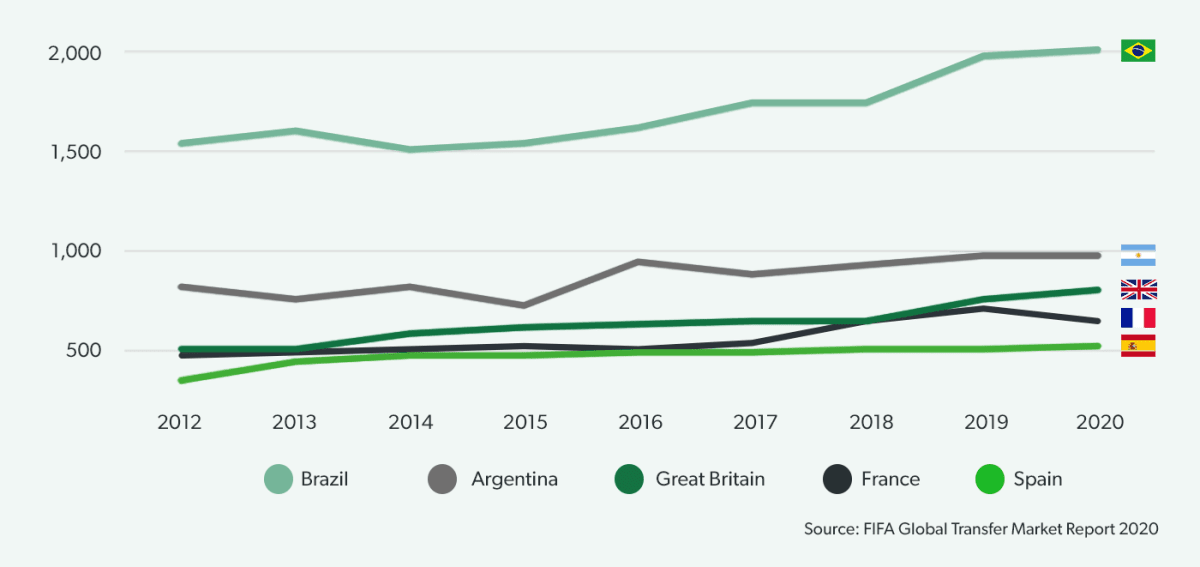
Brazil remains a powerhouse of player development
Over 2,000 Brazilian players moved internationally in 2020 – more than twice the number of Argentinians, the next highest nationality. Indeed, South American leagues have long been player export markets (the subject of an analysis coming up later in the year), with a focus on attacking players. Aside from a small dip in 2014, Brazil’s rise has been consistent since 2012, and the country has extended its lead at the top of the charts.
Indeed, all of the top five nationalities among international transfers have been increasing since 2012, although only the UK and Spain join Brazil in growing numbers in 2020. France and Argentina experienced slight declines.