As things stand, we are only four losses away from the first guaranteed relegation in Europe’s Big 5. France’s Dijon FCO and more surprisingly Germany’s Schalke 04 are both 13 points from safety with just 24 points left to play for.
In reality, it will very likely take fewer than four losses, as any points gained by teams immediately above will widen the gap. The same applies to the Premier League’s Sheffield United, needing a minimum of 14 points from the remaining 27 available; five further losses would seal their fate, but it will almost certainly take fewer.
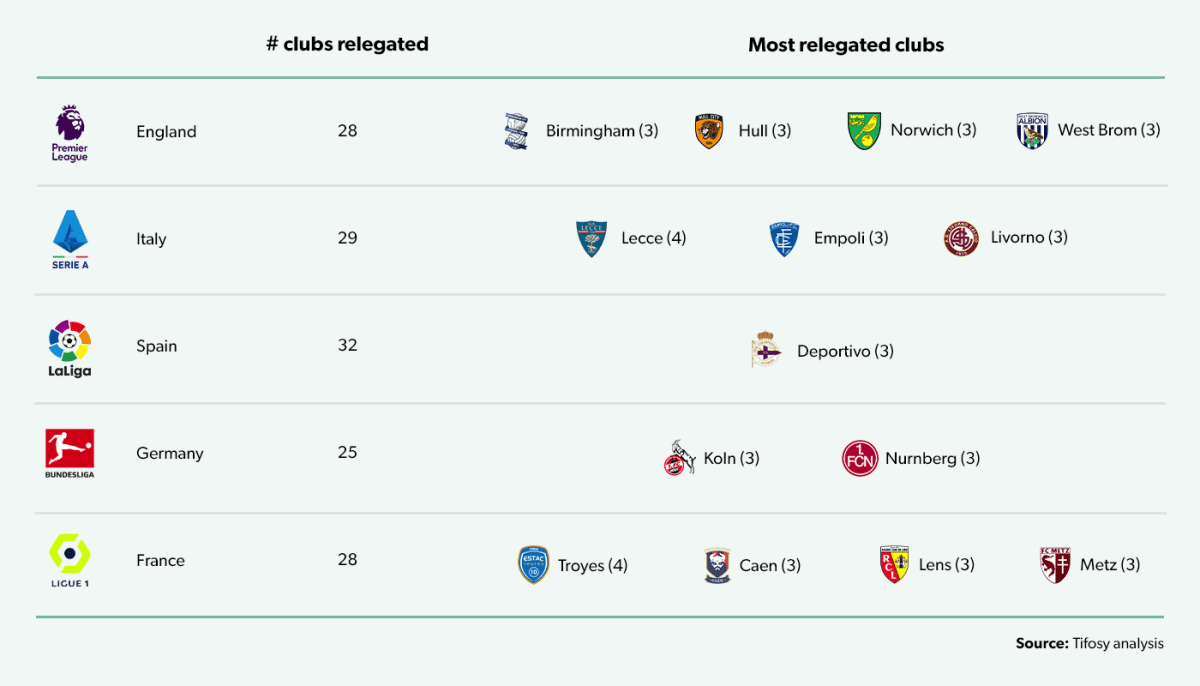
Over the past 15 years, 142 different clubs have experienced relegation from the Big 5 European leagues. The French, English and Italian leagues are average, while Spain boasts the highest number of individual clubs at 32 and Germany the lowest at 25. Spain’s high rotation is also illustrated by there being only one club to have been relegated three times in the 15-year period. At the other end of the scale France has three such clubs, and one four-times relegated club, while England has four three-timers.
Relegation is one of the most important aspects in the current structure of European football, bringing as much – arguably more – drama to the bottom of the league tables as the winning of trophies brings to the top. Relegation also poses an ever-present threat to clubs’ financial sustainability, valuation and return on owner investment. How a club’s leadership respond to the threat of relegation or its eventual occurrence often makes a huge difference to its long-term future.
THE DYNAMICS OF RELEGATION
We analysed 10 years of data from the Big 5 leagues, from 2005/06 to 2014/15 (stopping there to allow examination of what happens in the years after relegation) to understand the probabilities of relegation and re-promotion, as well as average finishing positions in relegation and promotion campaigns.
1) How likely is relegation?
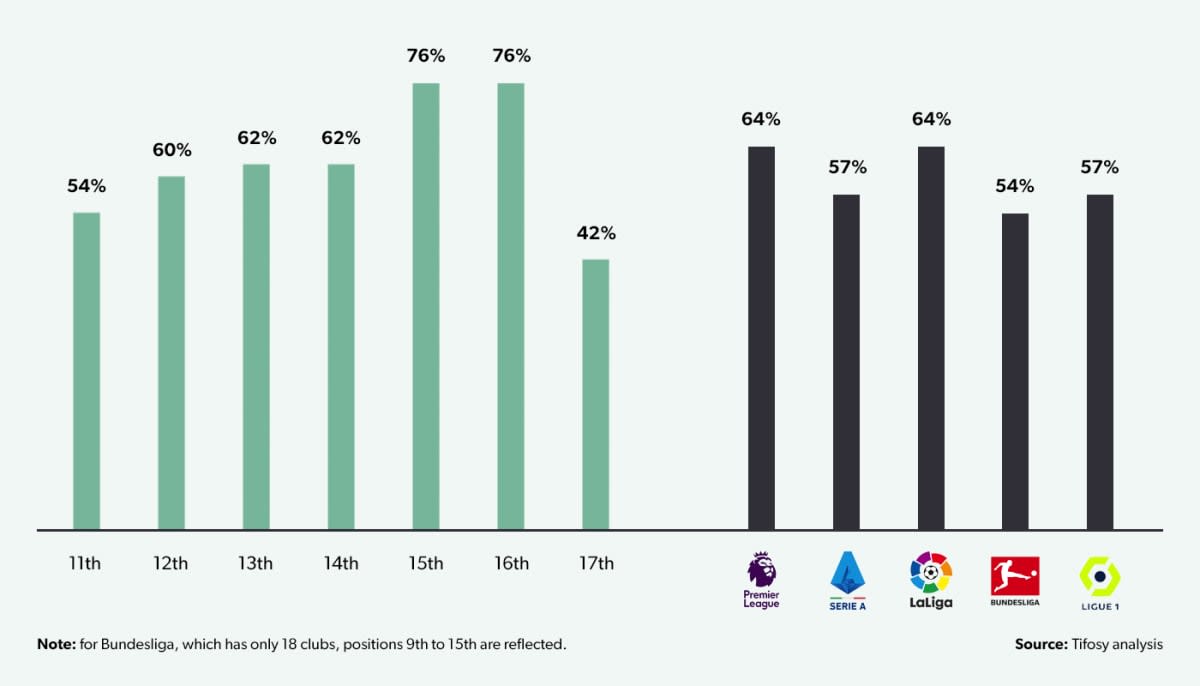
- The chance of relegation within the next 5 years steadily increases from 54% for those finishing in 11th place to 76% for those finishing in 15th and 16th place.
- Clubs finishing 17th far less likely to be relegated, at only 42%, suggesting that a near-miss drives strategy, personnel or investment changes to reduce the likelihood of relegation.
- Between the Big 5 European leagues, the highest probability of relegation within five years for a club finishing in 11th -17th place (9th – 15th place in Germany’s 18-club Bundesliga) is in the Premier League and La Liga, where clubs have almost a 2/3 chance of relegation if finishing in the bottom half of the table.
- The lowest probability of relegation is in the Bundesliga, as the relegation playoff for the club finishing in 16th place vs. the club finishing in 3rd place in the 2nd Bundesliga has an 80% success rate for the Bundesliga club. A similar playoff in France, in use since the 2016/17 season, makes no difference to the numbers as the clubs surviving it have all subsequently been relegated automatically within the five-year period.
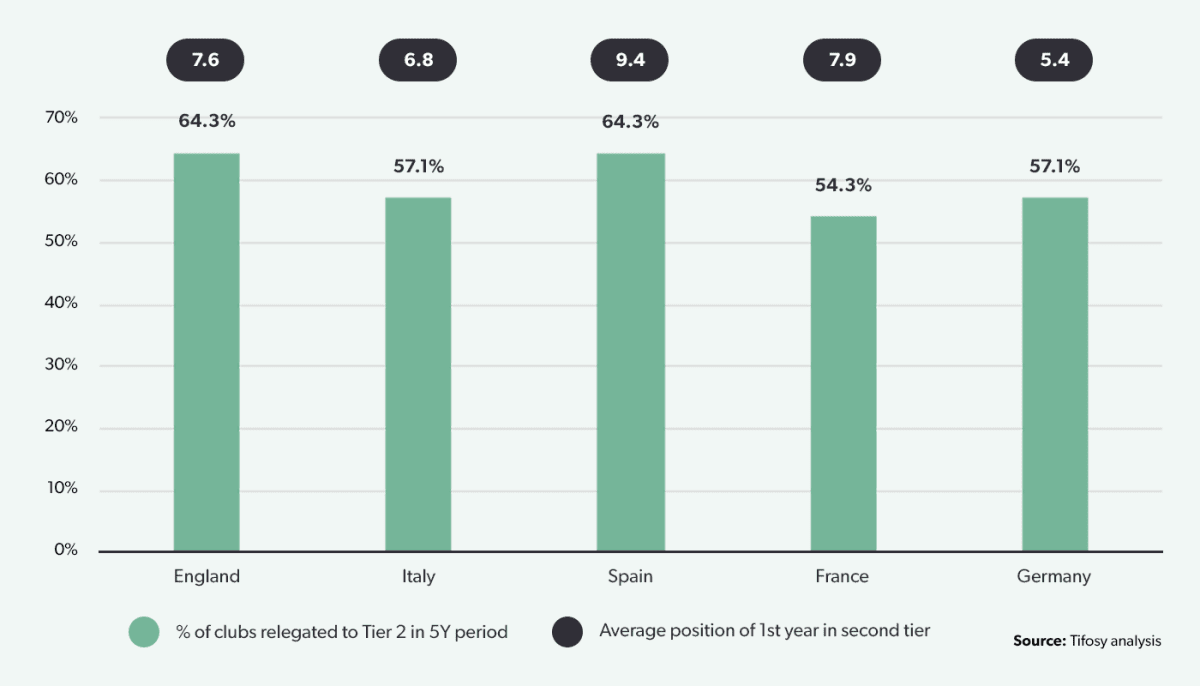
2) How do relegated clubs fare once in the second tier?
- The average finishing position for a relegated club in the second tier is 7.4, below the promotion playoff spots in all countries except Italy, where Serie B has two automatic promotion and six playoff spots. The highest average finish (even adjusted for number of teams) is in the 2nd Bundesliga at 5.4, still outside the playoff place awarded only to the club in 3rd place in that division.
- The clubs falling furthest on relegation are those in Spain, in position 9.4 on average, only just in the top half of the table and more than three places below the playoff spots.
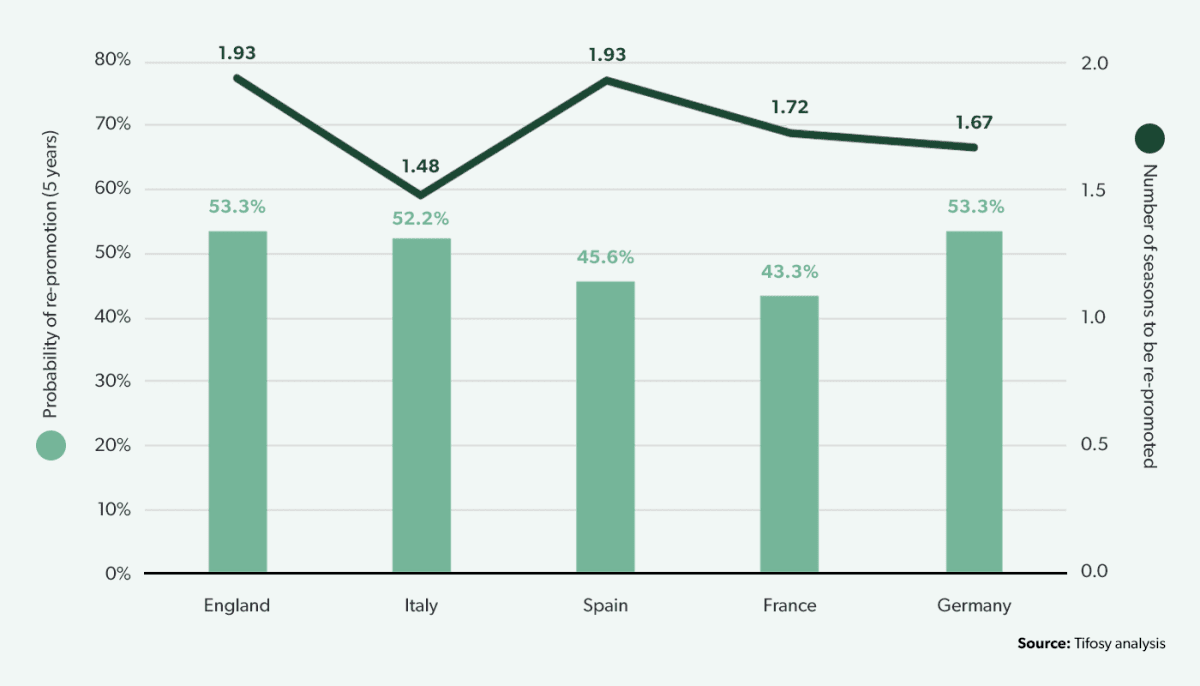
- The probability of being promoted back to the first division is fairly consistent with almost exactly a 50/50 chance on average across the Big 5 divisions. Clubs in the Premier League and Bundesliga stand the highest chances, while those in La Liga and Ligue 1 have the lowest probability of making it back up to the top-flight.
- The roughly half of clubs which do achieve promotion back to the top division within five years of being relegated do it quite quickly – in 1.75 seasons on average.
- The quickest bounce backs happen in Italy where it takes 1.48 seasons, helped by the two additional playoff spots vs. the other divisions except Germany. It takes longest to return to the top-flight in the Premier League and La Liga, perhaps indicating a more competitive second tier.
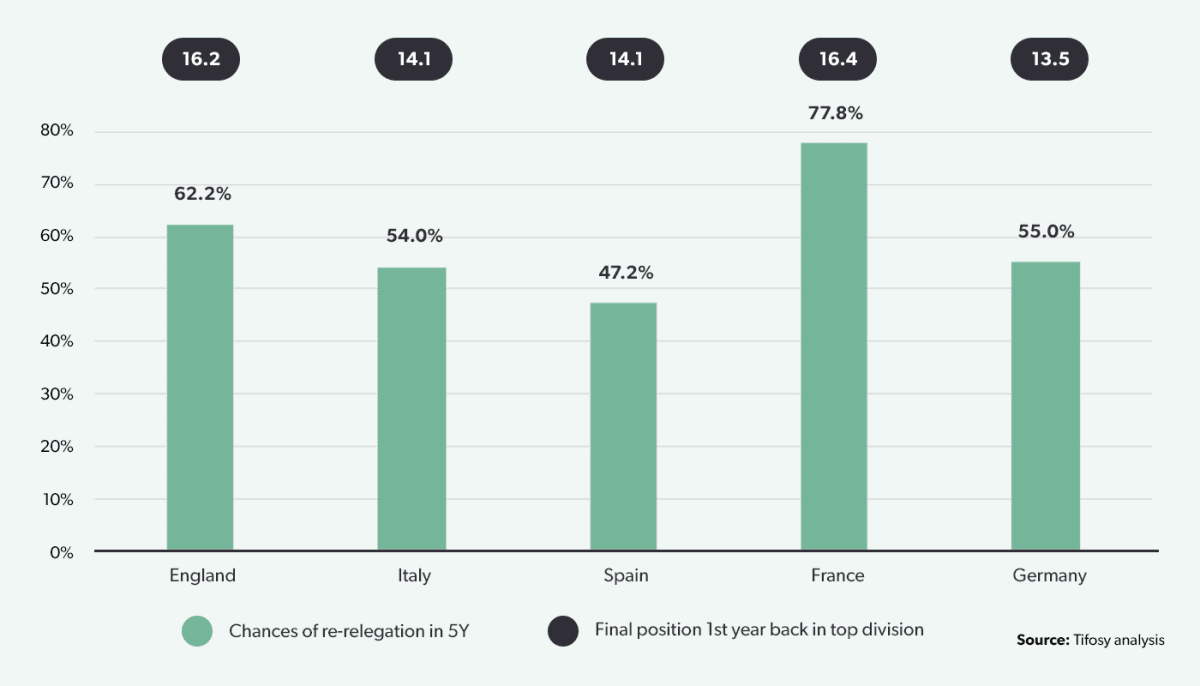
- Once promoted back to the top tier, clubs finish on average in position 14.8 (Bundesliga numbers adjusted to a 20-team format), a creditable two positions above the relegation zone.
- The probability of being relegated again within the same 5-year period is high, at 59.4%. There is variation between leagues, however, with a 47.2% probability of being relegated again in Spain (down 17 points from 64.3% first time around) and a contrasting 77.8% chance in France (up 23.5 points from 54.3%).
Part 2 – SQUAD AND MANAGERIAL CHANGES
When relegation does occur, how do clubs manage resources to cope with tighter finances in the lower division while maximising their chances of getting back to the top? And do they stick with the coach that fought for survival, or appoint someone new to build for promotion? The following data is from the same time period, 2005/06 to 2014/15.
1) How does squad value change on relegation?
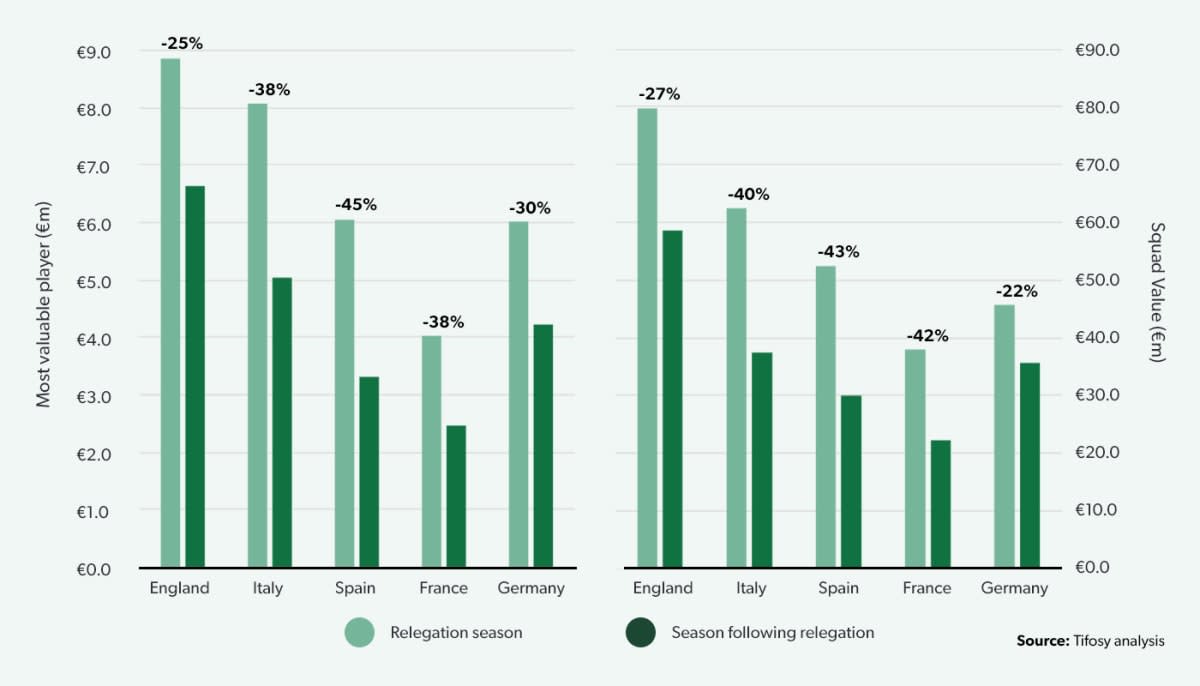
- In the 10-year period analysed, the average squad value was reduced from €55.7m to €36.7m following relegation, a fall of €19.0m or 34%, as relegated clubs sell player assets to align wage bills with income levels in the lower division and avoid breaching profitability and sustainability regulations.
- Clubs in Germany and England trim squads more conservatively, reducing the value by 22% and 27% respectively – though in absolute terms the drop in England (€21.3m) is more than double that in Germany (€10m). The steepest drop is seen in Spain where clubs relegated from La Liga cut squad value by 43% (€22.6m), closely followed by France at 42% (€16.0m) and Italy at 40% (the largest cut in absolute at €24.9m).
- A very similar pattern is visible in the most valuable player in the squad, as clubs jettison their top performers. On the most valuable player in the first season in the second tier is worth €2.3m or 34% less than the most valuable player in the squad when the club was relegated.
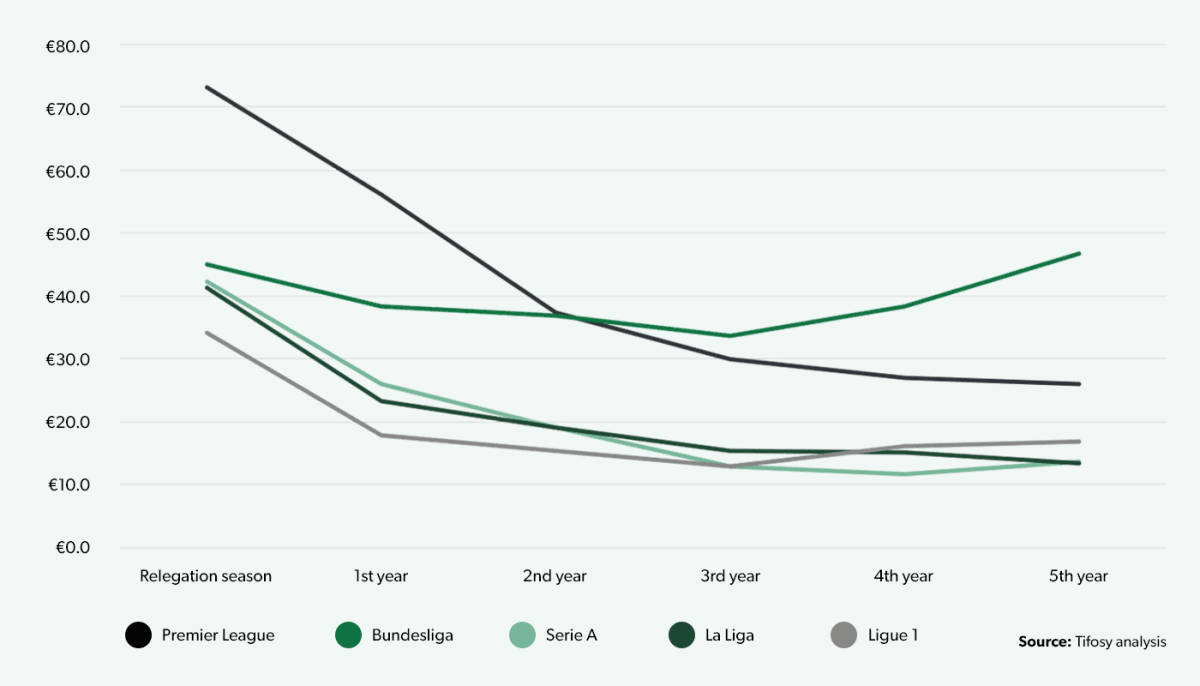
- For clubs not fortunate enough to be promoted quickly, the financial constraints of the second tier see squads trimmed each year: on average across the Big 5 squad value drops 11% each year over the following five years.
- Proportionately, the sharpest declines – of 17.2% each year – are seen in Seria A and La Liga, where squads drop from an average of €42.3m and €41.3m respectively in the relegation season to just €13.6m and €13.3m respectively in the fifth year following the drop.
- The Premier League falls slightly less sharply, at 15.9% per annum, but the absolute change is the largest, from €75.2m to €25.9m, a drop of almost €50m in five years.
- The decline in Ligue 1 is not as steep at 11% per annum, while clubs relegated from the Bundeliga actually increase squad value by 4% from €45.0m to €46.7m on average after five years, although value does drop to a low after three years of 25% less than the relegation season.
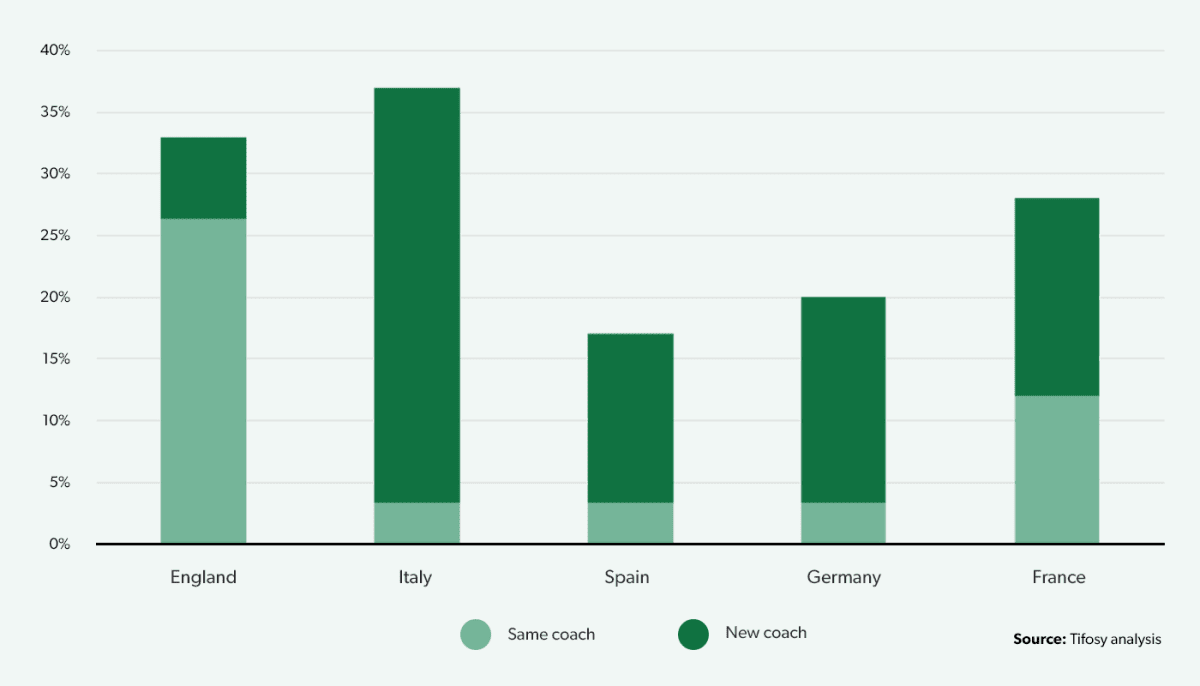
2) How often do clubs change their manager – before and after relegation?
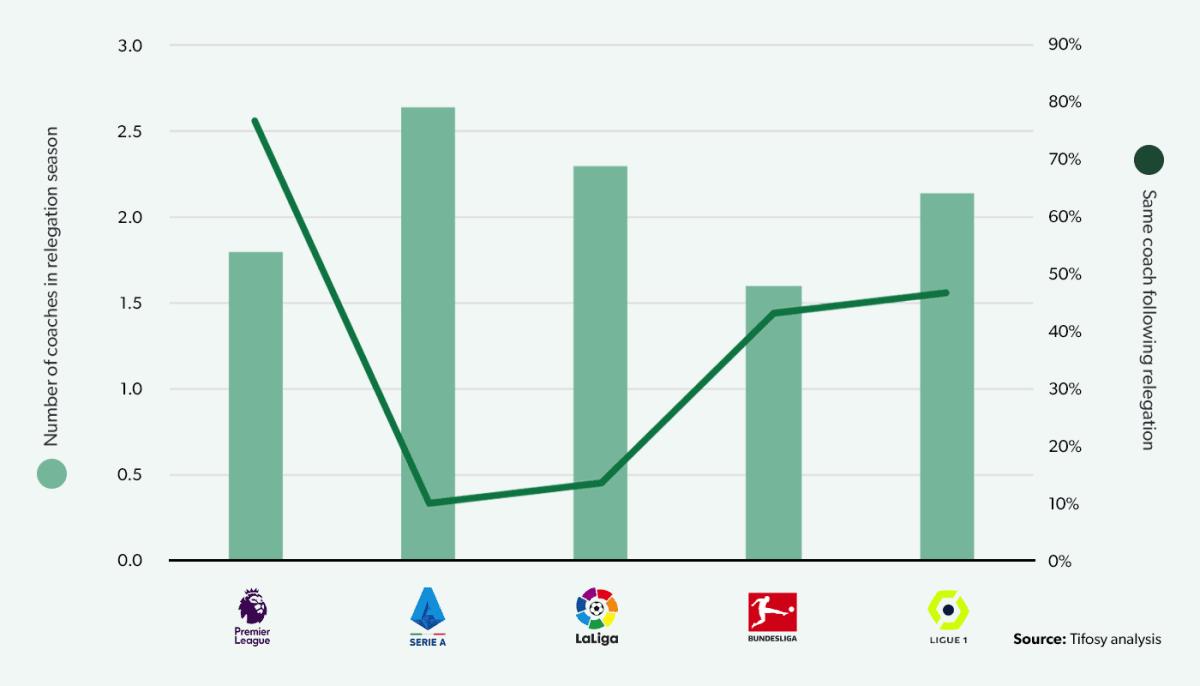
- The average number of head coaches or managers in the dugout during a club’s relegation season is 2.1. The number rises to 2.6 in Italy’s Serie A, while the fewest changes take place in France’s Ligue 1 with 1.6 on average. The Premier League is just above at 1.8 managers.
- Where the leagues differ more dramatically is in the retention of final incumbent. Not only do Italy and Spain make the highest number of managerial changes during a relegation-doomed season, only 10% and 14% of managers in the hot seat at the end of the season are kept on for the following season in the second tier. In England almost four in five (77%) of head coaches are entrusted with the task of securing promotion – at least initially.
- There does not appear to be a pattern between the choice to retain the relegated coach and the likelihood of immediate promotion back to the top tier.
- The league to which the highest percentage of clubs achieve a bounce-back promotion is Serie A with 37%, 4 in 5 of which were achieved with a new manager at the helm.
- Meanwhile in England, where 77% of managers presiding over relegation keep their jobs, 33% of clubs still manage to get back to the top-flight at their first attempt.